Deep Dive into Retina Open-Source Kubernetes Network Observability
Introduction
As maintainers of the Retina project, we are committed to delivering an open-source, cloud-agnostic network observability platform for Kubernetes clusters. Retina was designed by the Azure Container Networking team to empower DevOps and SecOps teams to visualize, debug, and analyze network traffic in containerized applications, regardless of environment.
Project Overview and Goals
Our mission with Retina is to provide a centralized, extensible hub for monitoring application connectivity, network health, and security posture in Kubernetes—independent of cloud, on-premises infrastructure, operating system, or CNI plugin. We aim to democratize deep network insights for every cluster, not just those using specialized networking solutions.
Key objectives include:
- Unified Network Visibility – By leveraging kernel-level instrumentation (eBPF on Linux, analogous mechanisms on Windows), Retina captures rich telemetry about pod-to-pod traffic, service connectivity, DNS queries, packet drops, and more, all without requiring application changes or sidecar proxies. This enables actionable insights into microservice communication and potential issues.
- Environment Agnosticism – Retina is designed to work seamlessly across any Kubernetes platform—Azure, AWS, Google Cloud, on-premises, or hybrid. Our CNI-agnostic approach and support for both Linux and Windows nodes ensure broad compatibility for enterprises operating multi-cloud or heterogeneous clusters.
- DevOps & SecOps Use Cases – Retina addresses both operational performance monitoring and security/compliance needs. It supports on-demand troubleshooting (such as packet capture for failing microservices) and continuous monitoring (metrics and alerts on dropped packets, DNS errors, or suspicious traffic spikes).
- Open Source Collaboration – Released under the MIT License, Retina welcomes community innovation. Our architecture is built for extensibility, allowing users to contribute plugins, integrations, and new capabilities. We encourage contributions that expand telemetry sources or exporters, ensuring Retina evolves through real-world feedback.
Since its announcement in early 2024, Retina has stood out for its modular plugin architecture and deep integration with the Cilium Hubble observability stack, while remaining independent of any specific network stack. Below, we detail how Retina’s architecture achieves these goals.
System Architecture and Design
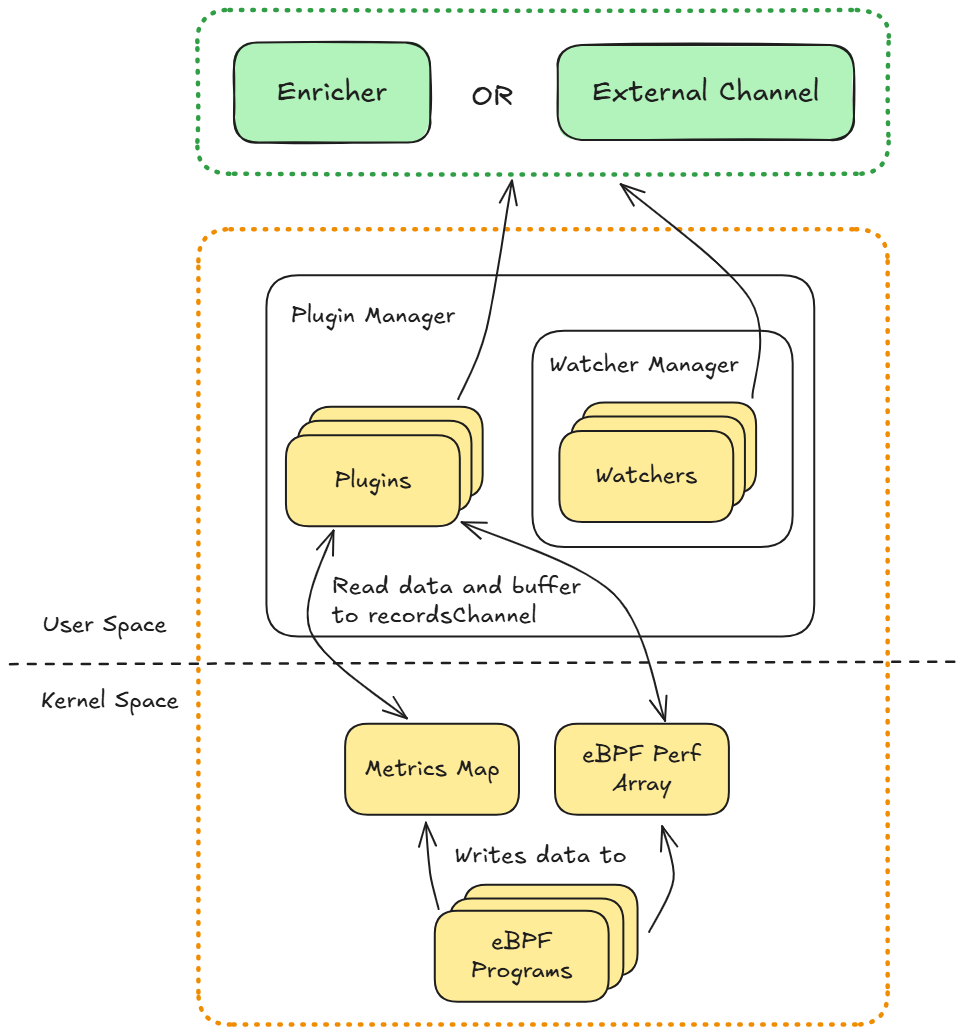 High-level architecture of the Retina agent’s data plane and control plane.
Retina’s architecture is layered, comprising a kernel-space data collection layer and a user-space processing layer, with two export modes. Each node runs a Retina agent that collects raw network telemetry from the host kernel, processes it, and exports it for consumption by monitoring tools such as Prometheus, Grafana, or Hubble UI. Modularity and extensibility are central, with a plugin system for instrumenting kernel events via eBPF.
- eBPF Data Plane (Kernel Space): On Linux, Retina loads custom eBPF programs at startup, each provided by a plugin. These programs attach to kernel hooks (socket events, network stack hooks, tracepoints) to capture events and metrics with minimal overhead. Data is recorded in eBPF maps (for aggregate metrics) or perf ring buffers (for streaming events). This allows a single eBPF probe per node to monitor all pods, eliminating the need for per-container sidecars. On Windows, where eBPF is unavailable, Retina uses Windows networking APIs (HNS, VFP) to gather similar data.
- Plugin Manager and Plugins (User Space): The Plugin Manager initializes and controls a set of plugins (Go modules), each with a focused responsibility (e.g., packet drops, DNS queries, interface traffic). Plugins set up kernel hooks, collect data, and emit unified flow records (adopting Cilium’s “flow” structure for consistency). The manager ensures all enabled plugins run and can reconcile them as needed. This pluggable design makes Retina easy to extend—new telemetry sources can be added by implementing the standard interface. Built-in plugins include Drop Reason, DNS, Packet Forward, and more.
- Watchers and Kubernetes Context: Retina’s watchers collect essential Kubernetes metadata for enriching raw network data. For example, the Endpoint Watcher tracks pod network interfaces, while the Kubernetes API Watcher monitors API server IPs. These populate an in-memory IP-to-object cache, mapping IPs to pod names, namespaces, node names, and labels. This enables real-time enrichment of flow data, supporting cluster-wide views such as “traffic by namespace” or “top talkers by service.” For scalability, Retina can use a lightweight CRD (RetinaEndpoint) to mirror only the necessary pod info, reducing API server load in large clusters.
Control Plane
Retina operates in one of two control plane modes, configurable at deployment, which determine how flow data is processed and exported.
Hubble Control Plane (Linux)
In Hubble mode, Retina integrates with Cilium’s Hubble observability stack. Plugins write flow records into an external channel (shared memory ring), which a Monitor Agent watches. The Monitor Agent forwards new flow events to a local Hubble Observer, which parses and enriches them with Kubernetes context using Cilium libraries and Retina’s IP cache.
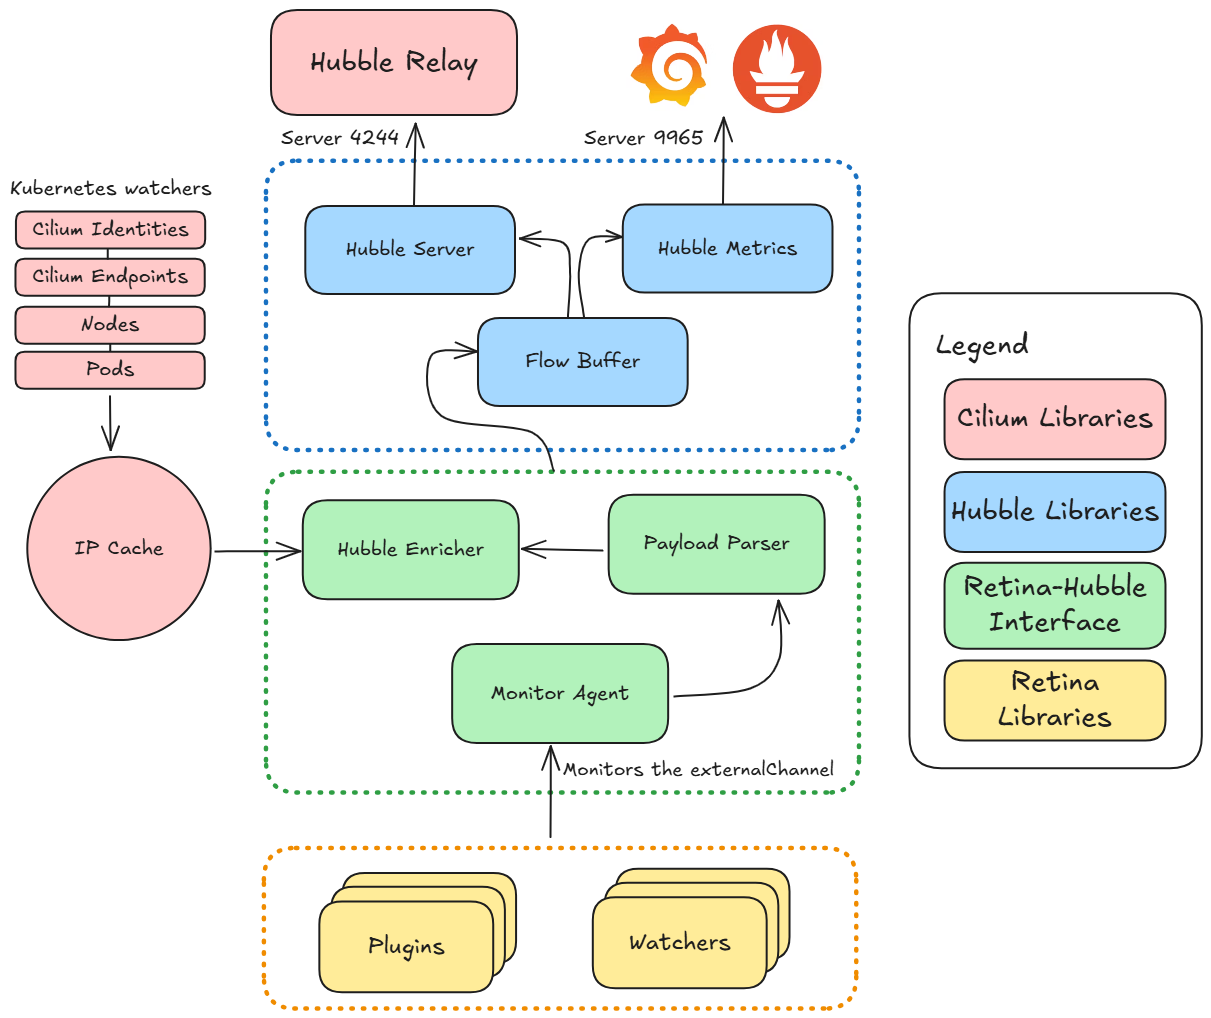 Retina running in Hubble Control Plane mode on a Linux cluster.
This integration exposes:
- Prometheus metrics on TCP port 9965, labeled as hubble_*metrics, including node-level and pod-level stats.
- Flow logs accessible via Hubble’s APIs (local UNIX socket or port 4244 for cluster-wide flows), enabling tools like Hubble CLI or UI to retrieve live flow data.
With Hubble mode, Retina brings the full Hubble experience—flow visibility, UI, CLI, and metrics—to clusters not running Cilium. On AKS, this powers “Advanced Network Observability,” allowing Hubble’s interface to work with Azure CNI or other CNIs. Note: Hubble mode requires Linux; Windows nodes default to standard mode.
Standard Control Plane
In standard mode, Retina handles flow processing internally. Plugins send flow records to an internal Enricher, which attaches Kubernetes metadata. Flows are then passed to the Metrics Module, which aggregates and exposes them as Prometheus metrics (counters, histograms, etc.) on each node. Metrics include networkobservability_packets_forwarded_total, networkobservability_packets_dropped_total, networkobservability_dns_request_total, and more, broken down by node or pod. This mode works on all platforms (Linux and Windows) but offers slightly less detail than Hubble mode. As the project matures, we plan to deprecate standard mode in favor of Hubble, aiming for deeper integration and broader compatibility.
Data Plane
The data plane is responsible for high-performance, low-overhead collection and processing of network telemetry.
- eBPF Programs: Retina’s eBPF programs hook into the kernel’s networking stack, capturing packets, extracting metadata, and storing it in eBPF maps.
- eBPF Maps: These key-value stores share data between eBPF programs and user-space applications, holding telemetry such as packet headers, flow records, and connection tracking info.
- Data Aggregation: Users can control the granularity of telemetry, from low-level packet captures to high-level flow records, based on use case and performance needs.
Plugins Model
Our plugin model is highly extensible, enabling users to customize and extend Retina’s functionality.
- Plugin Lifecycle: Plugins initialize by setting up eBPF maps, sockets, and resources, then start reading and processing data, exporting it according to control plane configuration.
- Plugin Interface: All plugins implement a common interface, ensuring seamless integration with the data plane.
- Data Export: Depending on control plane mode, plugins send data to the Enricher or an external channel for Hubble. Plugins may also use syscalls or APIs to collect additional telemetry.
- Extensibility: The modular architecture and well-defined interface make it straightforward to develop custom plugins for specific use cases.
BPF Implementation
Retina attaches eBPF probes to kernel hooks for non-intrusive monitoring, with features including:
- Dual-stack instrumentation: Metrics from both API server interactions and kernel-level packet processing.
- Low-overhead design: <1% CPU/memory footprint per node.
- Windows compatibility: Alternative data collection for Windows nodes.
Plugins dynamically load/unload BPF probes, use shared maps for cross-plugin data, and attach hooks conditionally (e.g., DNS monitoring on port 53).
BPF Hook Points
| Hook Point | Layer | Use Case |
|---|---|---|
| Socket filter BPF program on raw socket | Link layer | (packetforward) Monitor node traffic |
| TC clsact qdisc on ingress/egress of veth & default interface | Linux traffic control | (packetparser) Capture detailed flows |
| kprobes/kretprobes/fexit | Kernel | (dropreason) Kernel network stack |
| Inspektor Gadget DNS tracer | Network/Transport layer | (dns) DNS resolution tracking |
| Inspektor Gadget TCP retransmission tracer | Transport layer | (tcpretrans) Detect TCP retransmissions |
Key implementation details:
- TC Hook Chaining: Preserves existing CNI chain integrations.
- CO-RE Compliance: Ensures cross-kernel compatibility.
- Per-Pod Filtering: Isolates metrics per workload using cgroup IDs.
This architecture enables granular, cloud-agnostic observability through plugin-defined BPF attachment.
Integration with Control Plane
Retina’s data plane and plugins are tightly integrated with the control plane, which manages configuration and operation. The control plane centralizes monitoring and integrates with various storage and visualization backends.
In summary, Retina’s BPF implementation delivers high-performance, low-overhead observability for Kubernetes networking, with extensibility at its core.
Retina Plugins Detail
Each plugin targets a specific aspect of networking or system events and can attach one or more eBPF programs at different attachments points in the kernel to collect telemetry. This design allows Retina to be extensible – new plugins with custom eBPF probes can be added for additional data sources. Some plugins rely on eBPF for data collection, while others use existing system counters or external tracer libraries.
In the next sections we summarize all Retina plugins (as of Retina v0.0.33) with their eBPF attachment points, operating layer, usage, and other details.
dropreason
BPF Attachment:
kprobe/kretprobe/fexiton nf_hook_slow, nf_nat_inet_fn, __nf_conntrack_confirm, tcp_v4_connect, inet_csk_acceptLayer: Kernel network stack (Netfilter hooks and TCP sockets)
Usage: Intercepts packet drop events in the kernel (iptables rules, NAT failures, conntrack drops, failed TCP connect/accept) and counts dropped packets/bytes by reason and direction
Details: Requires
CAP_SYS_ADMIN. Multiple eBPF programs work in tandem to classify drop reasons. In advanced mode, enriches drop events with pod info and exports as flow records for per-pod metrics.
packetforward
BPF Attachment: Socket filter BPF program attached to
raw socketon host’s primary interfaceLayer: Link layer (captures packets at the network interface via socket)
Usage: Passively monitors all packets passing through the node’s main interface, counting packets and bytes by direction. Provides node-level traffic volume metrics.
Details: Requires
CAP_BPF. Uses a classic eBPF socket filter program similar to tcpdump’s capture mechanism. Metrics are reported at node level with no per-pod breakdown.
linuxutil
BPF Attachment: None (no eBPF program; uses OS utilities)
Layer: N/A (User-space stats collection)
Usage: Gathers general host network stats from kernel counters – TCP/UDP socket statistics and interface statistics – by parsing /proc/net/netstat and using ethtool for NIC stats
Details: Requires
CAP_BPF. This plugin uses existing kernel data sources instead of custom BPF, reducing overhead. Basic/Advanced metrics are identical since data comes directly from system counters.
dns
BPF Attachment:
Inspektor Gadget DNS tracer(built on eBPF) tracking DNS socket eventsLayer: Network/Transport layer (DNS over UDP/TCP traffic)
Usage: Monitors DNS queries and responses in real time, counting requests, responses, error codes, and other DNS metrics
Details: Requires
CAP_SYS_ADMIN. Leverages open-source Inspektor Gadget DNS gadget. In advanced mode, enriches DNS events with pod info and exports flows for per-pod DNS metrics.
packetparser
BPF Attachment:
TC(clsact qdisc) with BPF cls/filter programs on ingress and egress of pod veth interfaces and host’s default interfaceLayer: Linux traffic control (OSI Layer 3/4)
Usage: Captures every TCP/UDP packet to/from pods and the node, allowing detailed flow records. Used for on-demand deep packet inspection and flow export.
Details: Requires
CAP_NET_ADMINandCAP_SYS_ADMIN. Attaches filters on both ingress and egress to capture traffic in both directions. Generates only advanced flows enriched with Kubernetes metadata.
tcpretrans
BPF Attachment:
Inspektor Gadget TCP Retransmissiontracer (eBPF-based)Layer: Transport layer (TCP stack events)
Usage: Detects and measures TCP retransmissions – packets that had to be re-sent due to loss or lack of ACK
Details: Requires
CAP_SYS_ADMIN. Internally uses Inspektor Gadget’s logic. In advanced mode, retransmission events are converted into enriched flow records with pod info.
ciliumEventObserver
BPF Attachment: None (relies on Cilium’s existing eBPF programs)
Layer: Varies (leverages Cilium’s kernel hooks)
Usage: Integrates with Cilium CNI: subscribes to the Cilium monitor socket to collect network flow events already generated by Cilium’s eBPF programs
Details: No elevated BPF capability needed. Avoids conflicts by consuming Cilium’s output instead of attaching additional eBPF filters. Converts Cilium’s events into Retina flow objects.
hnsstats
BPF Attachment: None (uses Windows networking APIs)
Layer: N/A (Windows OS networking stack)
Usage: Collects network statistics on Windows nodes – TCP connection stats and packet counts for HNS and VFP
Details: No eBPF usage. Interfaces with Windows networking subsystems to gather counters. Provides similar metrics to Linux plugins but in a Windows context.
infiniband
BPF Attachment: None (uses sysfs interfaces)
Layer: N/A (User-space, reads kernel sysfs)
Usage: Gathers InfiniBand network interface statistics – Nvidia InfiniBand port counters and link debug status
Details: Requires
CAP_BPF. Does not load any eBPF program – relies on kernel-provided counters in sysfs. Extends Retina to support high-performance InfiniBand networks.
Architecture Design Priorities
We emphasize:
- Extensibility: Retina’s modular design allows straightforward addition of new data sources or export integrations. The clean separation of plugins and control plane ensures the core always produces flow records, and new consumers can be added easily.
- Low Overhead: By running eBPF in the kernel, Retina minimizes per-packet processing in user space. Metrics collection is on-demand and configurable, and Prometheus handles storage/querying, keeping on-node resource usage minimal.
- CNI/OS Independence: Retina operates at the generic kernel level, requiring no specific CNI or kernel build. It supports any CNI and both Linux and Windows nodes, using appropriate instrumentation for each.
This layered design—plugins and eBPF for data capture, watchers and caches for context, and either Hubble or Retina’s own modules for metrics/logs—delivers detailed, cloud-neutral network insight, consumable via industry-standard tools or Hubble UI/CLI.
Deployment and Typical Usage Patterns
Retina is deployed as a Kubernetes-native DaemonSet (one agent pod per node), with optional supporting components. We provide a Helm chart for easy installation.
To install Retina with the Standard control plane and Basic metrics mode:
1
2
3
4
5
6
7
8
VERSION=$( curl -sL https://api.github.com/repos/microsoft/retina/releases/latest | jq -r .name)
helm upgrade --install retina oci://ghcr.io/microsoft/retina/charts/retina \
    --version $VERSION \
    --namespace kube-system \
    --set image.tag=$VERSION \
    --set operator.tag=$VERSION \
    --set logLevel=info \
    --set enabledPlugin_linux="\[dropreason\,packetforward\,linuxutil\,dns\]"
A typical workflow:
- Installation via Helm: Install Retina from GHCR using Helm. The chart deploys the retina-agent DaemonSet (e.g., in
kube-system), scheduling a pod on every node. Configuration options include enabling Windows support, selecting control plane mode, and enabling the operator for CRD-driven captures. By default, pods have the necessary privileges for eBPF or Windows instrumentation and expose a metrics endpoint (port 10093) with Prometheus annotations. - Integrating with Monitoring Tools: After deployment, configure Prometheus to scrape Retina metrics. Grafana dashboards are available for visualization. In Hubble mode, you may deploy Hubble Relay and UI for graphical flow exploration; in standard mode, use Grafana dashboards.
- Retina CLI (kubectl plugin): The CLI, installable via Krew, provides commands for managing captures, checking system status, and launching debug shells. It wraps Kubernetes API calls and is best used from a Linux environment.
- Metrics Mode (Continuous Monitoring): Retina collects basic metrics by default. Advanced pod-level metrics (remote or local context) can be enabled for more granularity, configurable via CRD or Helm values. All metrics are exposed as Prometheus metrics, supporting alerting and dashboard integration.
- On-Demand Packet Captures: Retina orchestrates distributed packet capture jobs for deep network debugging. Captures can be initiated via CLI or CRD, targeting specific pods/nodes, with results stored in cloud storage or PVCs for offline analysis. On Linux, eBPF pcap tracers are used; on Windows, pktmon is leveraged.
- Trace and Shell (Advanced Debugging): The CLI offers experimental commands for tracing and interactive debugging, further streamlining troubleshooting.
Deployment Workflow
The typical workflow is:
- Deploy the DaemonSet.
- Set up Prometheus/Grafana for continuous monitoring.
- When anomalies are detected, use the CLI or CRDs to investigate, enable detailed metrics, run captures, and query flows via Hubble if enabled.
Retina integrates naturally with Kubernetes workflows, lowering adoption barriers for DevOps teams.
Supported Platforms and Integrations
Retina is designed for broad compatibility across Kubernetes distributions, cloud providers, and operating systems.
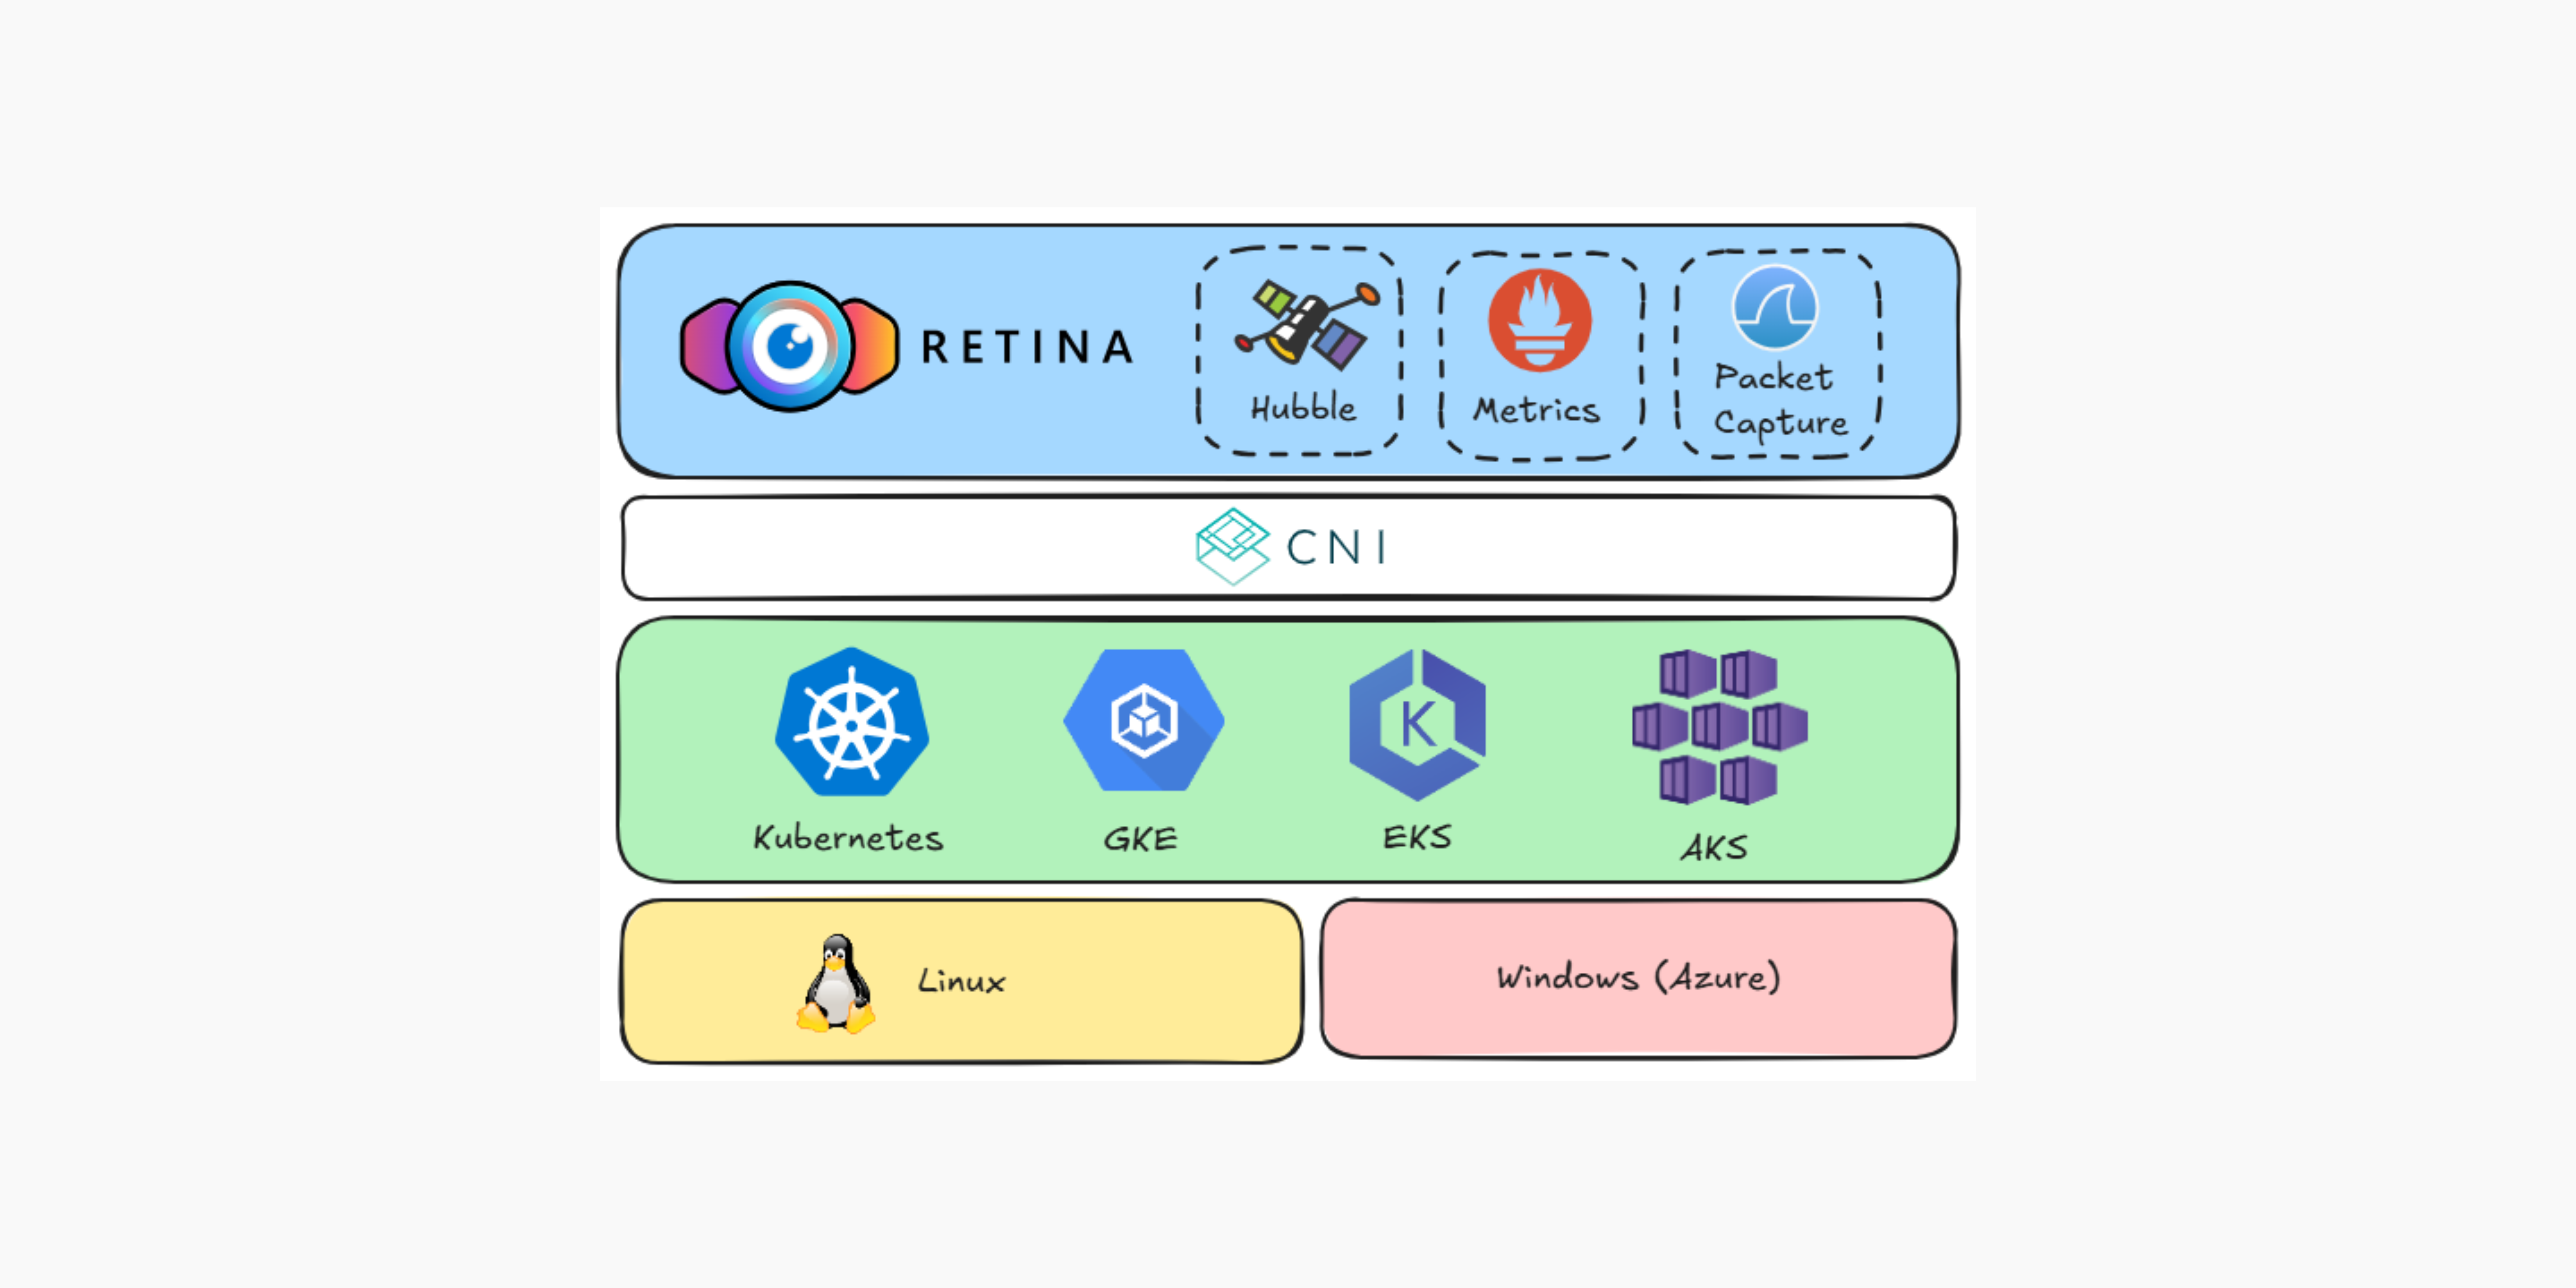 Overview of Retina support.
- Kubernetes Distributions: Retina is distribution-agnostic, deployable on managed services (AKS, EKS, GKE) or self-managed clusters. No Azure-specific dependencies—Retina runs anywhere Kubernetes does.
- Operating Systems: Both Linux and Windows nodes are supported. On Linux, eBPF provides deep telemetry; on Windows, HNS and VFP are used. Windows support is evolving and currently limited to standard control plane and basic metrics.
- CNI / Network Stack: Retina works with any CNI, focusing on kernel-level events rather than CNI-specific logs. This makes it a drop-in addition to any Kubernetes environment.
- Cloud Integration: Retina exports metrics to Azure Monitor and Log Analytics, with pre-built Grafana dashboards for AKS. Integration with AWS CloudWatch or GCP Stackdriver is possible via Prometheus.
- Observability Stacks: Retina integrates with Prometheus & Grafana, Cilium Hubble (for flow logs and UI), and can be extended to other exporters. The plugin architecture supports community-driven integrations.
Retina enhances, rather than replaces, your monitoring stack, delivering consistent insights across diverse infrastructure.
Real-World Use Cases and Scenarios
Retina’s value is most evident in real-world scenarios:
- Debugging Pod Connectivity Issues: When services can’t communicate, Retina enables rapid, automated distributed packet capture and drop metrics, drastically reducing troubleshooting time.
- Continuous Monitoring of Network Health: Operators can set up alerts and dashboards for DNS failures, API server latency, or packet drops, gaining ongoing visibility into cluster networking.
- Security Auditing and Compliance: Flow logs (in Hubble mode) and metrics support security investigations and compliance reporting, enabling quick identification of unexpected connections or data transfers.
- Multi-Cluster / Multi-Cloud Visibility: Retina standardizes network observability across clouds, supporting unified dashboards and processes for SRE teams.
These scenarios demonstrate how Retina accelerates insight and simplifies complex network investigations, aligning with established workflows and interfaces.
Contributing to the Retina Project
Retina is open-source (MIT License) and welcomes community contributions. Our governance follows Microsoft’s Code of Conduct, and contributors sign a CLA. The repository includes a CONTRIBUTING.md and setup documentation. We encourage contributions in code, documentation, integration, and testing. Weekly office hours and GitHub Discussions provide direct channels for engagement.
Contribution areas:
- Code: Add new metrics, protocols, or improve platform support.
- Documentation: Improve tutorials, examples, and clarity.
- Integration and Testing: Report compatibility, integrate with new tools, and share findings.
Our community is active and growing, with regular meetings and responsive maintainers. We value real-world feedback and contributions that help Retina evolve.
Challenges, Limitations, and Roadmap
While Retina is powerful, we are transparent about current limitations and ongoing development:
- Maturity and Stability: Retina is under active development (0.x releases). Expect frequent updates as we refine best practices and prepare for a 1.0 milestone.
- Dual Control Plane: We plan to unify around Hubble mode, simplifying the codebase and documentation. Windows support for Hubble depends on eBPF for Windows or alternative approaches.
- Windows Limitations: Windows nodes currently offer basic metrics only, with no flow logs. We are monitoring eBPF for Windows developments to enhance support.
- Performance and Scalability: Users should configure metrics modes thoughtfully to avoid high cardinality in large clusters. We are exploring dynamic tuning and performance safeguards.
- eBPF Interference and Kernel Constraints: Running multiple eBPF tools can lead to conflicts or resource contention. We recommend auditing existing eBPF utilities and are collaborating with the community on best practices.
- User Experience and UI: Retina relies on Grafana and Hubble UI for visualization. We are open to feedback on UI enhancements and integration with Kubernetes UIs.
- Comparison with Alternatives: Retina complements existing tools (Cilium/Hubble, Pixie, etc.) and is designed for extensibility and integration.
Future Direction
We are focused on:
- Quality improvements, stability and performance.
- Expanding plugins and metrics (e.g., L7 tracing, network policy violation metrics).
- Enhancing CRD automation (e.g., scheduled captures, in-system alerts).
- Supporting edge cases (IPv6, dual-stack).
- Growing documentation and real-world guides.
Our roadmap is transparent, with issues and discussions tracked on GitHub. Microsoft’s ongoing investment ensures Retina will continue to mature and integrate with Azure services.
Summary of Limitations
- Windows: Only standard metrics, no flow logs; uses HNS/Pktmon, less feature-rich than eBPF.
- Hubble dependency: Full functionality on Linux requires Hubble components; standard mode will be phased out.
- Resource tuning: Users must configure metrics modes to avoid high Prometheus load in large environments.
- Multi-tool conflicts: Caution when running alongside other eBPF tools.
- Early-stage: Expect rapid changes and ongoing improvements.
Outlook
Retina’s roadmap is promising. The move toward a unified Hubble-based control plane will deliver a cleaner, more powerful solution. Community contributions are key to expanding capabilities, and Microsoft’s support ensures production hardening and long-term viability. We look forward to regular releases, improved performance, and broader compatibility as Retina becomes a standard for Kubernetes network observability.
Conclusions
Retina delivers deep, actionable insight into Kubernetes networking, with a focus on extensibility, efficiency, and broad compatibility. As we continue to develop and refine the project, we invite users and contributors to join us in shaping the future of cloud-native network observability.
References
- eBPF distributed networking observability tool for Kubernetes (GitHub - microsoft/retina)
- What is Retina? (Retina Docs)
- Retina (Retina Docs)
- Architecture (Retina Docs)
- Metrics (Retina Docs)
- Standard Metric Modes (Retina Docs)
- Capture (Retina Docs)
- Contributing (Retina Docs)
- Microsoft Azure Introduces Retina: a Cloud Native Container Networking Observability Platform - InfoQ
- A look at Retina on AKS (Teknews Blog)
- Announcing Advanced Container Networking Services for your Azure Kubernetes Service clusters (Microsoft Azure Blog)
- Microsoft open sources Retina: A cloud-native container networking observability platform (Microsoft Azure Blog)
- eBPF-Powered Observability Beyond Azure: A Multi-Cloud Perspective with Retina (Microsoft Azure Blog)