Monitoring Linux Kernel Network Latency with eBPF, Prometheus, and Grafana
Introduction
This project aims to make sense of eBPF events by creating meaningful data visualizations for kernel events, turning low-level metrics into actionable insights.
As modern systems become increasingly complex, understanding kernel-level behavior is essential for optimizing performance and diagnosing bottlenecks. In this project, we leverage the power of eBPF to monitor network latency at the kernel level, export the data as Prometheus metrics, and visualize the results in Grafana dashboards.
The original GitHub repository with the full codebase found at this link.
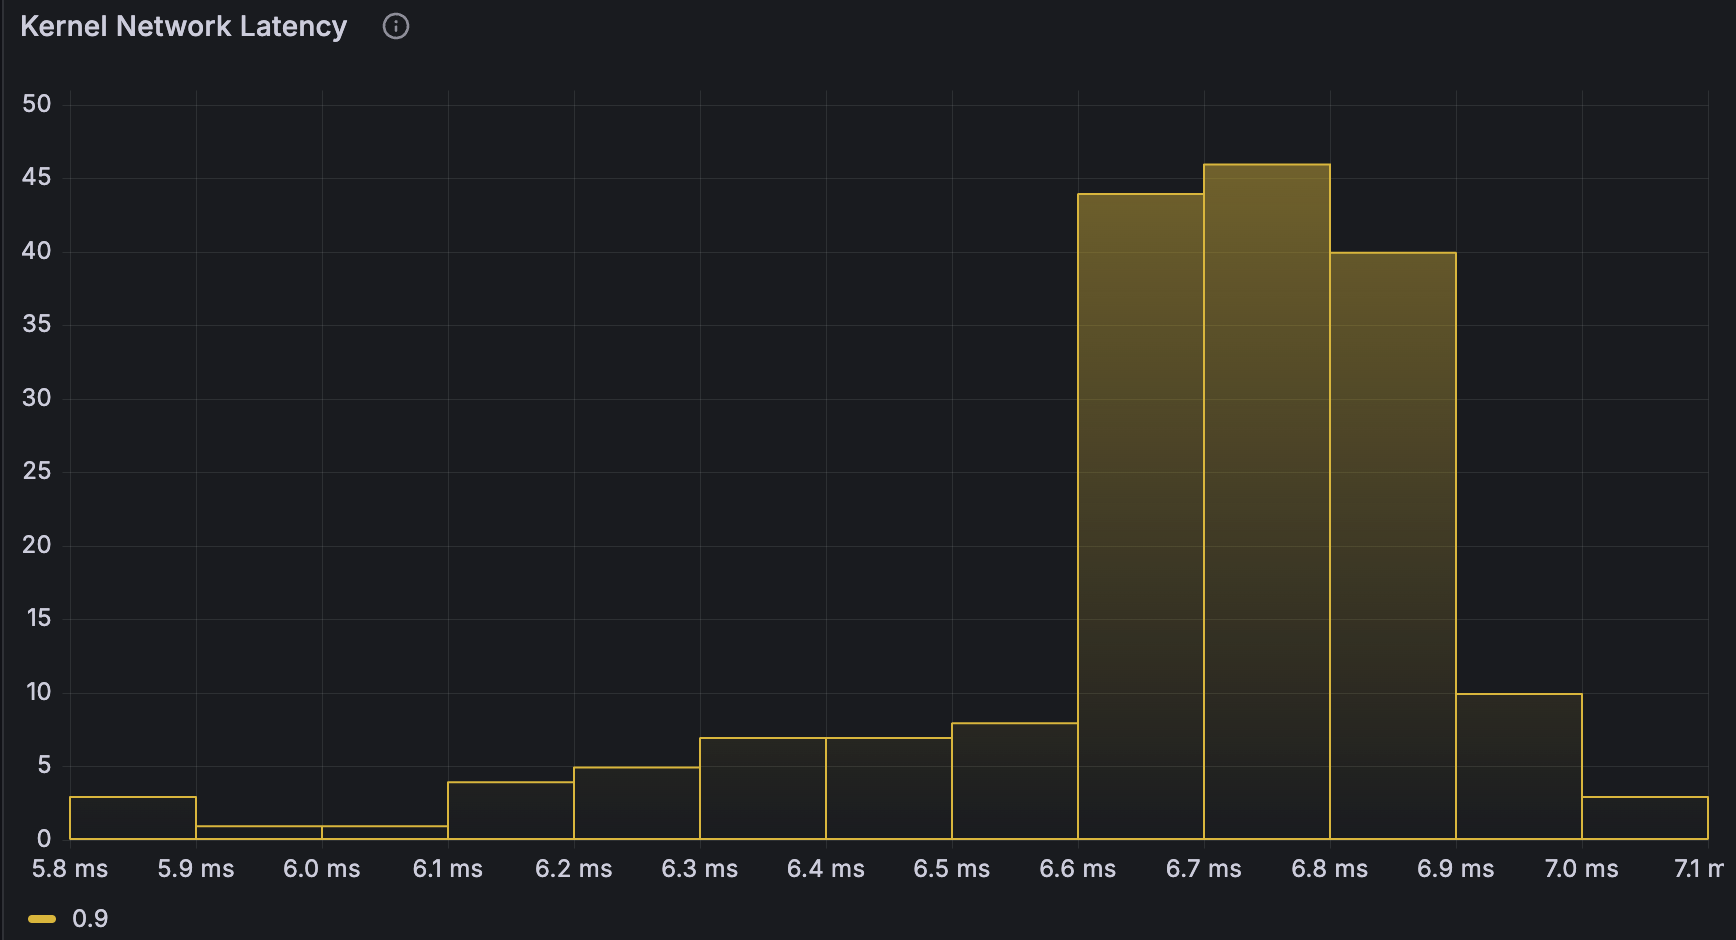 p90 Kernel Networking Latency
Prerequisites
- Linux
kernel version >= 5.15 - Debian/Ubuntu distribution
- clang is a language front-end and tooling infrastructure for languages in the C language family.
- llvm is a collection of modular and reusable compiler and toolchain technologies.
- libbpf-dev is a library for loading eBPF programs and reading and manipulating eBPF objects from user-space.
- go
- Docker
- Helm
- Kubectl
1
sudo apt-get install clang llvm libbpf-dev -y
BPF program
This eBPF program is designed to monitor network packet latency within the Linux kernel. It attaches to two kernel functions, ip_rcv and ip_rcv_finish, using kprobes. When a packet is received (ip_rcv), the program extracts the IP header and constructs a key based on the packet’s hash. It then creates a latency_t structure, which includes the timestamp of when the packet was received and the IP addresses. This structure is stored in a BPF hash map called latency_map.
When the packet processing is finished (ip_rcv_finish), the program retrieves the corresponding latency_t structure from the hash map using the same key. It updates the structure with the timestamp of when the packet processing finished and calculates the latency. This latency information is then printed to the kernel log and sent to user space via a BPF ring buffer called events. Finally, the entry is removed from the hash map to free up space. The program is licensed under the GPL.
1
2
3
4
5
6
7
8
9
10
11
12
13
14
15
16
17
18
19
20
21
22
23
24
25
26
27
28
29
30
31
32
33
34
35
36
37
38
39
40
41
42
43
44
45
46
47
48
49
50
51
52
53
54
55
56
57
58
59
60
61
62
63
64
65
66
67
68
69
70
71
72
73
74
75
76
77
78
79
80
81
82
83
84
85
86
87
88
89
90
91
92
93
94
95
96
97
98
99
100
101
102
103
104
105
106
107
108
109
110
111
112
113
114
115
116
117
118
119
120
121
122
123
124
125
126
127
128
129
130
131
132
#include "vmlinux.h"
#include <bpf/bpf_helpers.h>
#include <bpf/bpf_tracing.h>
#include <bpf/bpf_endian.h>
#include <bpf/bpf_core_read.h>

#define ETH_P_IP 0x800

struct l3 {
    __be32 src_ip;
    __be32 dst_ip;
    __u8 h_proto;
};

struct latency_t {
    __u64 timestamp_in;
    __u64 timestamp_out;
    __u64 delta;
    struct l3 layer_3;
};

struct {
    __uint(type, BPF_MAP_TYPE_HASH);
    __uint(max_entries, 1024);
    __type(key, __u32);
    __type(value, struct latency_t);
} latency_map SEC(".maps");

struct {
    __uint(type, BPF_MAP_TYPE_RINGBUF);
    __uint(max_entries, 4096); // Size of the ring buffer
} events SEC(".maps");

static inline struct l3 build_l3( struct iphdr *iphr, struct sk_buff *skb) {
    // Get source and destination ip addresses
    __be32 src, dst;
    __u32 id;
    __u8 proto;

    bpf_probe_read_kernel(&src, sizeof(src), &iphr->saddr);
    bpf_probe_read_kernel(&dst, sizeof(dst), &iphr->daddr);
    bpf_probe_read_kernel(&proto, sizeof(proto), &iphr->protocol);

    // Initialize IPv4 key
    struct l3 layer_3 = {
        .src_ip = src,
        .dst_ip = dst,
        .h_proto = proto
    };

    return layer_3;
}

static inline __u32 get_key(struct sk_buff *skb) {
    __u32 id;
    bpf_probe_read_kernel(&id, sizeof(id), &skb->hash);
    return id;
}


// get the ip header from the skb
static inline struct iphdr *get_iphdr(struct sk_buff *skb) {
    void* head;
    u16 offset;
    u32 hash;
    struct iphdr *iphr;

    // Get the network header
    bpf_probe_read_kernel(&head, sizeof(head), &skb->head);
    bpf_probe_read_kernel(&offset, sizeof(offset), &skb->network_header);

    // Get the ip header
    iphr = (struct iphdr *)(head + offset);
    if (!iphr) {
        bpf_printk("Failed to get IP header\n");
        return 0;
    }
    return iphr;
}

SEC("kprobe/ip_rcv")
int ip_rcv(struct pt_regs *ctx) {
    // Get the socket buffer
    struct sk_buff *skb = (struct sk_buff *)PT_REGS_PARM1(ctx);
    // Get the ip header
    struct iphdr *iphr = get_iphdr(skb);
    // Build the key
    __u32 key = get_key(skb);
    // Build layer 3 struct
    struct l3 layer_3 = build_l3(iphr, skb);

    // Initialize latency structure and set timestamp
    struct latency_t latency = {
        .timestamp_in = bpf_ktime_get_ns(),
        .layer_3 = layer_3
    };

    // Update latency map with the new data
    bpf_map_update_elem(&latency_map, &key, &latency, BPF_ANY);

    return 0;
}

SEC("kprobe/ip_rcv_finish")
int ip_rcv_finish(struct pt_regs *ctx) {
    // Get the socket buffer
    struct sk_buff *skb = (struct sk_buff *)PT_REGS_PARM3(ctx);
    // Get the ip header
    struct iphdr *iphr = get_iphdr(skb);
    // Build the key
    __u32 key = get_key(skb);

    struct latency_t *latency = bpf_map_lookup_elem(&latency_map, &key);
    if (latency) {
        // Update latency struct
        latency->timestamp_out = bpf_ktime_get_ns();
        latency->delta = ( latency->timestamp_out - latency->timestamp_in ) / 1000;
        // Print latency
        bpf_printk("latency: %llu ms\n", latency->delta);
        // Send event to user space via ring buffer
        void *data = bpf_ringbuf_reserve(&events, sizeof(*latency), 0);
        if (data) {
            __builtin_memcpy(data, latency, sizeof(*latency));
            bpf_ringbuf_submit(data, 0);
        }
        // Delete latency from map
        bpf_map_delete_elem(&latency_map, &key);
    }
    return 0;
}

char LICENSE[] SEC("license") = "GPL";
User Space Go Application
This program collects and exposes network packet latency metrics to Prometheus using eBPF (Extended Berkeley Packet Filter). It attaches probes to kernel functions related to packet reception and processing, capturing timestamps at different stages of packet processing. The program calculates the latency and records the source and destination IP addresses along with the protocol type. The collected data is exposed as Prometheus metrics, which can be scraped and visualized using Prometheus and Grafana. The program sets up a ring buffer to read events from the eBPF program and processes these events in a separate goroutine, converting the raw data into a human-readable format and updating Prometheus metrics accordingly.
The eBPF program defines maps for storing latency data and events, and includes functions to extract IP headers and build latency structures. Probes are attached to the ip_rcv and ip_rcv_finish kernel functions to capture packet reception and processing timestamps. The user-space Go application reads events from the ring buffer, updates Prometheus metrics, and serves the metrics endpoint via an HTTP server. This setup allows Prometheus to scrape the metrics at regular intervals, providing a powerful and efficient way to monitor network latency in real-time.
1
2
3
4
5
6
7
8
9
10
11
12
13
14
15
16
17
18
19
20
21
22
23
24
25
26
27
28
29
30
31
32
33
34
35
36
37
38
39
40
41
42
43
44
45
46
47
48
49
50
51
52
53
54
55
56
57
58
59
60
61
62
63
64
65
66
67
68
69
70
71
72
73
74
75
76
77
78
79
80
81
82
83
84
85
86
87
88
89
90
91
92
93
94
95
96
97
98
99
100
101
102
103
104
105
106
107
108
109
110
111
112
113
114
115
116
117
118
119
120
121
122
123
124
125
126
127
128
129
130
131
132
133
134
135
136
137
138
139
140
141
142
143
144
145
146
147
148
149
150
151
152
153
154
155
156
157
158
159
160
161
162
163
164
165
166
167
168
169
170
171
172
173
174
175
176
177
178
179
180
181
182
183
package main

import (
	"bytes"
	"encoding/binary"
	"fmt"
	"log"
	"net"
	"net/http"
	"os"
	"os/signal"
	"syscall"
	"time"

	"github.com/cilium/ebpf"
	"github.com/cilium/ebpf/link"
	"github.com/cilium/ebpf/ringbuf"
	"github.com/prometheus/client_golang/prometheus"
	"github.com/prometheus/client_golang/prometheus/promhttp"
	"golang.org/x/sys/unix"
)

const (
	bpfProgramPath = "./bpf/latency.o"
	memLockLimit   = 100 * 1024 * 1024 // 100MB
)

type LatencyT struct {
	TimestampIn  uint64
	TimestampOut uint64
	Delta        uint64
	Layer3       L3
}

type L3 struct {
	SrcIP  uint32
	DstIP  uint32
	HProto uint8
	// add padding to match the size of the struct in the BPF program
	_ [3]byte
}

var (
	Latency = prometheus.NewGaugeVec(
		prometheus.GaugeOpts{
			Name: "packets_count",
			Help: "Number of packets received",
		},
		[]string{"src_ip", "dst_ip"},
	)
	LatencyIstogram = prometheus.NewHistogramVec(
		prometheus.HistogramOpts{
			Name:    "latency_histogram",
			Help:    "Latency histogram",
			Buckets: prometheus.DefBuckets,
		},
		[]string{"src_ip", "dst_ip"},
	)
)

func init() {
	prometheus.MustRegister(Latency)
	prometheus.MustRegister(LatencyIstogram)
}

func main() {
	// Set the RLIMIT_MEMLOCK resource limit
	var rLimit unix.Rlimit
	rLimit.Cur = memLockLimit
	rLimit.Max = memLockLimit
	if err := unix.Setrlimit(unix.RLIMIT_MEMLOCK, &rLimit); err != nil {
		log.Fatalf("Failed to set RLIMIT_MEMLOCK: %v", err)
	}

	// Parse the ELF file containing the BPF program
	spec, err := ebpf.LoadCollectionSpec(bpfProgramPath)
	if err != nil {
		log.Fatalf("Failed to load BPF program: %v", err)
	}

	// Load the BPF program into the kernel
	coll, err := ebpf.NewCollection(spec)
	if err != nil {
		log.Fatalf("Failed to create BPF collection: %v", err)
	}
	defer coll.Close()

	// Attach BPF programs to kprobe receive events
	tp_rcv, err := link.Kprobe("ip_rcv", coll.Programs["ip_rcv"], &link.KprobeOptions{})
	if err != nil {
		log.Fatalf("Failed to attach trace_ip: %v", err)
	}
	defer tp_rcv.Close()

	// Attach BPF programs to kprobe return events
	tp_ret, err := link.Kprobe("ip_rcv_finish", coll.Programs["ip_rcv_finish"], &link.KprobeOptions{})
	if err != nil {
		log.Fatalf("Failed to attach trace_ip_output: %v", err)
	}

	// Set up ring buffer to read data from BPF program
	reader, err := ringbuf.NewReader(coll.Maps["events"])
	if err != nil {
		log.Fatalf("Failed to get ring: %v", err)
	}

	// Handle signals for graceful shutdown
	sig := make(chan os.Signal, 1)
	signal.Notify(sig, syscall.SIGINT, syscall.SIGTERM)

	// Goroutine to handle graceful shutdown on receiving a signal
	go func() {
		<-sig
		tp_rcv.Close()
		tp_ret.Close()
		coll.Close()
		os.Exit(0)
	}()

	go func() {
		// Read and print the output from the eBPF program
		var event LatencyT

		for {

			// Read data from the ring buffer
			data, err := reader.Read()
			if err != nil {
				log.Fatalf("Failed to read from ring buffer: %v", err)
			}

			if err := binary.Read(bytes.NewReader(data.RawSample), binary.LittleEndian, &event); err != nil {
				log.Printf("Failed to parse ring event: %v", err)
				continue
			}

			// Convert IP addresses to string format
			srcIP := toIpV4(event.Layer3.SrcIP)
			dstIP := toIpV4(event.Layer3.DstIP)

			// Increment Prometheus metric
			Latency.WithLabelValues(srcIP, dstIP).Inc()
			LatencyIstogram.WithLabelValues(srcIP, dstIP).Observe(float64(event.Delta))

			// Print the output
			fmt.Printf("TimestampIn: %s, TimestampOut: %s, Delta: %d, SrcIP: %s, DstIP: %s, HProto: %s\n", timestampToString(event.TimestampIn), timestampToString(event.TimestampOut), event.Delta, srcIP, dstIP, protoToString(event.Layer3.HProto))
		}
	}()

	// Start Prometheus HTTP server
	http.Handle("/metrics", promhttp.Handler())
	log.Fatal(http.ListenAndServe(":2112", nil))
}

func toIpV4(ip uint32) string {
	ipOut := make(net.IP, 4)                 // Create a 4-byte IP address
	binary.LittleEndian.PutUint32(ipOut, ip) // Convert uint32 to byte slice in little-endian order
	return ipOut.String()                    // Convert IP address to string format
}

func protoToString(protocol uint8) string {
	switch protocol {
	case 1:
		return "ICMP"
	case 2:
		return "IGMP"
	case 6:
		return "TCP"
	case 17:
		return "UDP"
	case 89:
		return "OSPF"
	default:
		return "Unknown"
	}
}

func timestampToString(timestamp uint64) string {
	// Convert the timestamp to a time.Time object
	t := time.Unix(0, int64(timestamp))
	// Format the time.Time object to a human-readable string
	return t.Format(time.RFC3339)
}
Compile the program
This command allows to compile the eBPF program written in C. The command utilizes clang, which is a compiler front end for the C, C++, and Objective-C programming languages.
Here’s a breakdown of the command:
clang: This is the compiler being used. Clang is part of the LLVM project and is known for its fast compilation times and excellent diagnostics.-O2: This flag tells the compiler to optimize the code for performance. The -O2 level is a moderate optimization level that balances compilation time and the performance of the generated code.-g: This flag includes debugging information in the compiled output. This is useful for debugging the eBPF program later.-target bpf: This specifies the target architecture for the compilation. In this case, it is bpf, which stands for Berkeley Packet Filter. This is necessary because eBPF programs run in a virtual machine inside the Linux kernel.-c latency.c: This tells the compiler to compile the source file xdp_ebpf_prog.c without linking. The -c flag indicates that the output should be an object file.-o latency.o: This specifies the name of the output file. In this case, the compiled object file will be named xdp_ebpf_prog.o.
In summary, this command compiles the xdp_ebpf_prog.c source file into an object file xdp_ebpf_prog.o with optimizations and debugging information, targeting the BPF architecture. This is a crucial step in developing eBPF programs, which are often used for tasks like network packet filtering and monitoring within the Linux kernel.
1
2
3
4
5
6
7
# Compile the BPF program with clang
# -O2: Optimize the code for better performance
# -g: Generate debug information
# -target bpf: Specify the target architecture as BPF
# -c: Compile the source file without linking
# -o: Specify the output file
clang -O2 -g -target bpf -c latency.c -o latency.o
Run Go Application
To run the user-space application which in turns will load and attach the BPF program, run the following:
1
2
# sudo priviledges are required to lock mamory for BPF
sudo go run main.go
This command will also start the HTTP server and register/export Prometheus metrics, which will be available at localhost:2112/metrics
Docker
To containerize this application so that we can run in isolation, we need to write a Dockerfile.
1
2
3
4
5
6
7
8
9
10
11
12
13
14
15
16
17
18
19
20
21
22
23
24
25
26
FROM --platform=$BUILDPLATFORM golang:1.23.4-alpine AS builder

WORKDIR /app

COPY bpf/latency.o ./bpf/
COPY go.mod go.sum main.go ./

RUN go mod download
RUN go build -o main .

# Final stage
FROM alpine:latest

WORKDIR /app

# Copy the binary from the build stage
COPY --from=builder /app/main .
COPY --from=builder /app/bpf/latency.o ./bpf/

# Ensure the container runs as root
USER root

# Export metrics port
EXPOSE 2112

CMD ["./main"]
The container image can be built as follows:
1
2
3
4
5
6
7
8
9
10
11
# set some build env variables
ARCH=$(uname -m)
IMAGE_REGISTRY=ghcr.io # docker.io
IMAGE_NAMESPACE=srodi # update this
IMAGE_TAG= $(git describe --tags --always)-$ARCH # make it unique
IMAGE:=$IMAGE_REGISTRY/$IMAGE_NAMESPACE/ebpf-prometheus-metrics/latency:$IMAGE_TAG
PLATFORM=linux/amd64 #linux/arm64
TARGETARCH=x86 #arm64

# build docker image
docker buildx build --platform $PLATFORM --build-arg TARGETARCH=$TARGETARCH -t $IMAGE -f docker/Dockerfile --push .
The newly built image can be run locally:
1
docker run --cap-add=SYS_ADMIN --cap-add=NET_ADMIN --cap-add=BPF --ulimit memlock=1073741824:1073741824 -p 2112:2112 $(IMAGE)
Deploy to Kubernetes
The following deploy.yaml manifest can be used to deploy to Kubernetes so that a Deployment and Service resources are created in the cluster:
1
2
3
4
5
6
7
8
9
10
11
12
13
14
15
16
17
18
19
20
21
22
23
24
25
26
27
28
29
30
31
32
33
34
35
36
37
38
39
40
41
42
43
44
45
46
47
48
49
50
51
52
53
54
55
56
57
58
59
60
# deploy.yaml
apiVersion: apps/v1
kind: Deployment
metadata:
  name: ebpf-network-latency
  labels:
    app: ebpf-network-latency
spec:
  replicas: 1
  selector:
    matchLabels:
      app: ebpf-network-latency
  template:
    metadata:
      labels:
        app: ebpf-network-latency
    spec:
      initContainers:
        - name: init-set-rlimit
          image: busybox
          command: ["sh", "-c", "ulimit -l 1073741824"]
          securityContext:
            privileged: true
      containers:
        - name: ebpf-exporter
          image: $IMAGE # Replace with your image!!!
          imagePullPolicy: Always
          securityContext:
            capabilities:
              add: ["CAP_NET_ADMIN", "CAP_SYS_ADMIN", "CAP_BPF"]
            privileged: true
          volumeMounts:
            - mountPath: /sys
              name: sys
              readOnly: true
            - mountPath: /sys/fs/bpf
              name: bpf
              readOnly: false
          ports:
            - containerPort: 2112
              name: metrics
      volumes:
        - name: sys
          hostPath:
            path: /sys
        - name: bpf
          hostPath:
            path: /sys/fs/bpf
---
apiVersion: v1
kind: Service
metadata:
  name: ebpf-network-latency
spec:
  ports:
    - name: metrics
      port: 2112
      targetPort: 2112
  selector:
    app: ebpf-network-latency
To deploy Kubernetes resources:
1
kubectl apply -f deploy.yaml
Prometheus
To access Prometheus metrics, you will need Prometheus to be deployed in your Kubernetes cluster.
Add the prometheus-community Helm chart:
1
helm repo add prometheus-community https://prometheus-community.github.io/helm-charts
Create a new values.yaml file with the following scrape config to have Prometheus scrape metrics from the default Kubernetes namespace.
1
2
3
4
5
6
7
8
9
10
prometheus:
  prometheusSpec:
    additionalScrapeConfigs:
      - job_name: 'kubernetes-service-endpoints'
        kubernetes_sd_configs:
          - role: endpoints
        relabel_configs:
          - source_labels: [__meta_kubernetes_namespace]
            action: keep
            regex: default
Deploy Prometheus chart using the values.yaml with the scrape config:
1
helm install kube-prometheus-stack prometheus-community/kube-prometheus-stack --values values.yaml
In order to access the ebpf-network-latency metrics, we also need a ServiceMonitor resource:
1
2
3
4
5
6
7
8
9
10
11
12
# servicemonitor.yaml
apiVersion: monitoring.coreos.com/v1
kind: ServiceMonitor
metadata:
  name: ebpf-network-latency
spec:
  selector:
    matchLabels:
      app: ebpf-network-latency
  endpoints:
    - port: metrics
      interval: 30s
To deploy servicemonitor.yaml:
1
kubectl apply -f servicemonitor.yaml
Grafana
Once the metrics are available in Prometheus, you can create a Grafana dashboard to visualize the Kernel Networking Latency in your Kubernetes cluster.
Grafana is already deployed part of prometheus-community/kube-prometheus-stack Helm chart. To Port-forward grafana:
1
kubectl port-forward $GRAFANA_POD_NAME 3000 -n $GRAFANA_POD_NAMESPACE
Grafana should be available at localhost:3000. You can now create a new dashboard using this Grafana dashboard JSON
Cleanup
Remove all Kubernetes resources:
1
2
3
kubectl delete -f servicemonitor.yaml
kubectl delete -f deploy.f
helm uninstall kube-prometheus-stack
Considerations
This tutorial aims to provide a starting point to create and export metrics from eBPF processed events.
The BPF program should be optimized for performance and quality, including improved error handling, reduce debug prints to minimize in-kernel footprint, and possibly reduce the number of events by introducing some additional filtering at BPF level.
This is by no means production-ready!
Conclusions
In this tutorial, we have explored how to leverage eBPF to capture kernel events and export them as Prometheus metrics. By using eBPF, we can efficiently monitor system performance with minimal overhead, providing valuable insights into kernel-level activities. We demonstrated the process of setting up eBPF programs, collecting metrics, and visualizing them using Prometheus and Grafana. This approach allows for real-time monitoring and can be customized to suit specific use cases, making it a powerful tool for system administrators and developers.
While the implementation presented here is not production-ready, it serves as a solid foundation for further development. Future improvements could include optimizing the eBPF programs for better performance, adding more sophisticated filtering mechanisms, and enhancing the Grafana dashboards for more detailed analysis. By continuing to refine and expand upon this setup, it is possible to create a robust monitoring solution that can provide deep insights into system behavior and help in proactive issue detection and resolution.
The original GitHub repository with the full codebase found at this link.