hotspot-bpf
Introduction
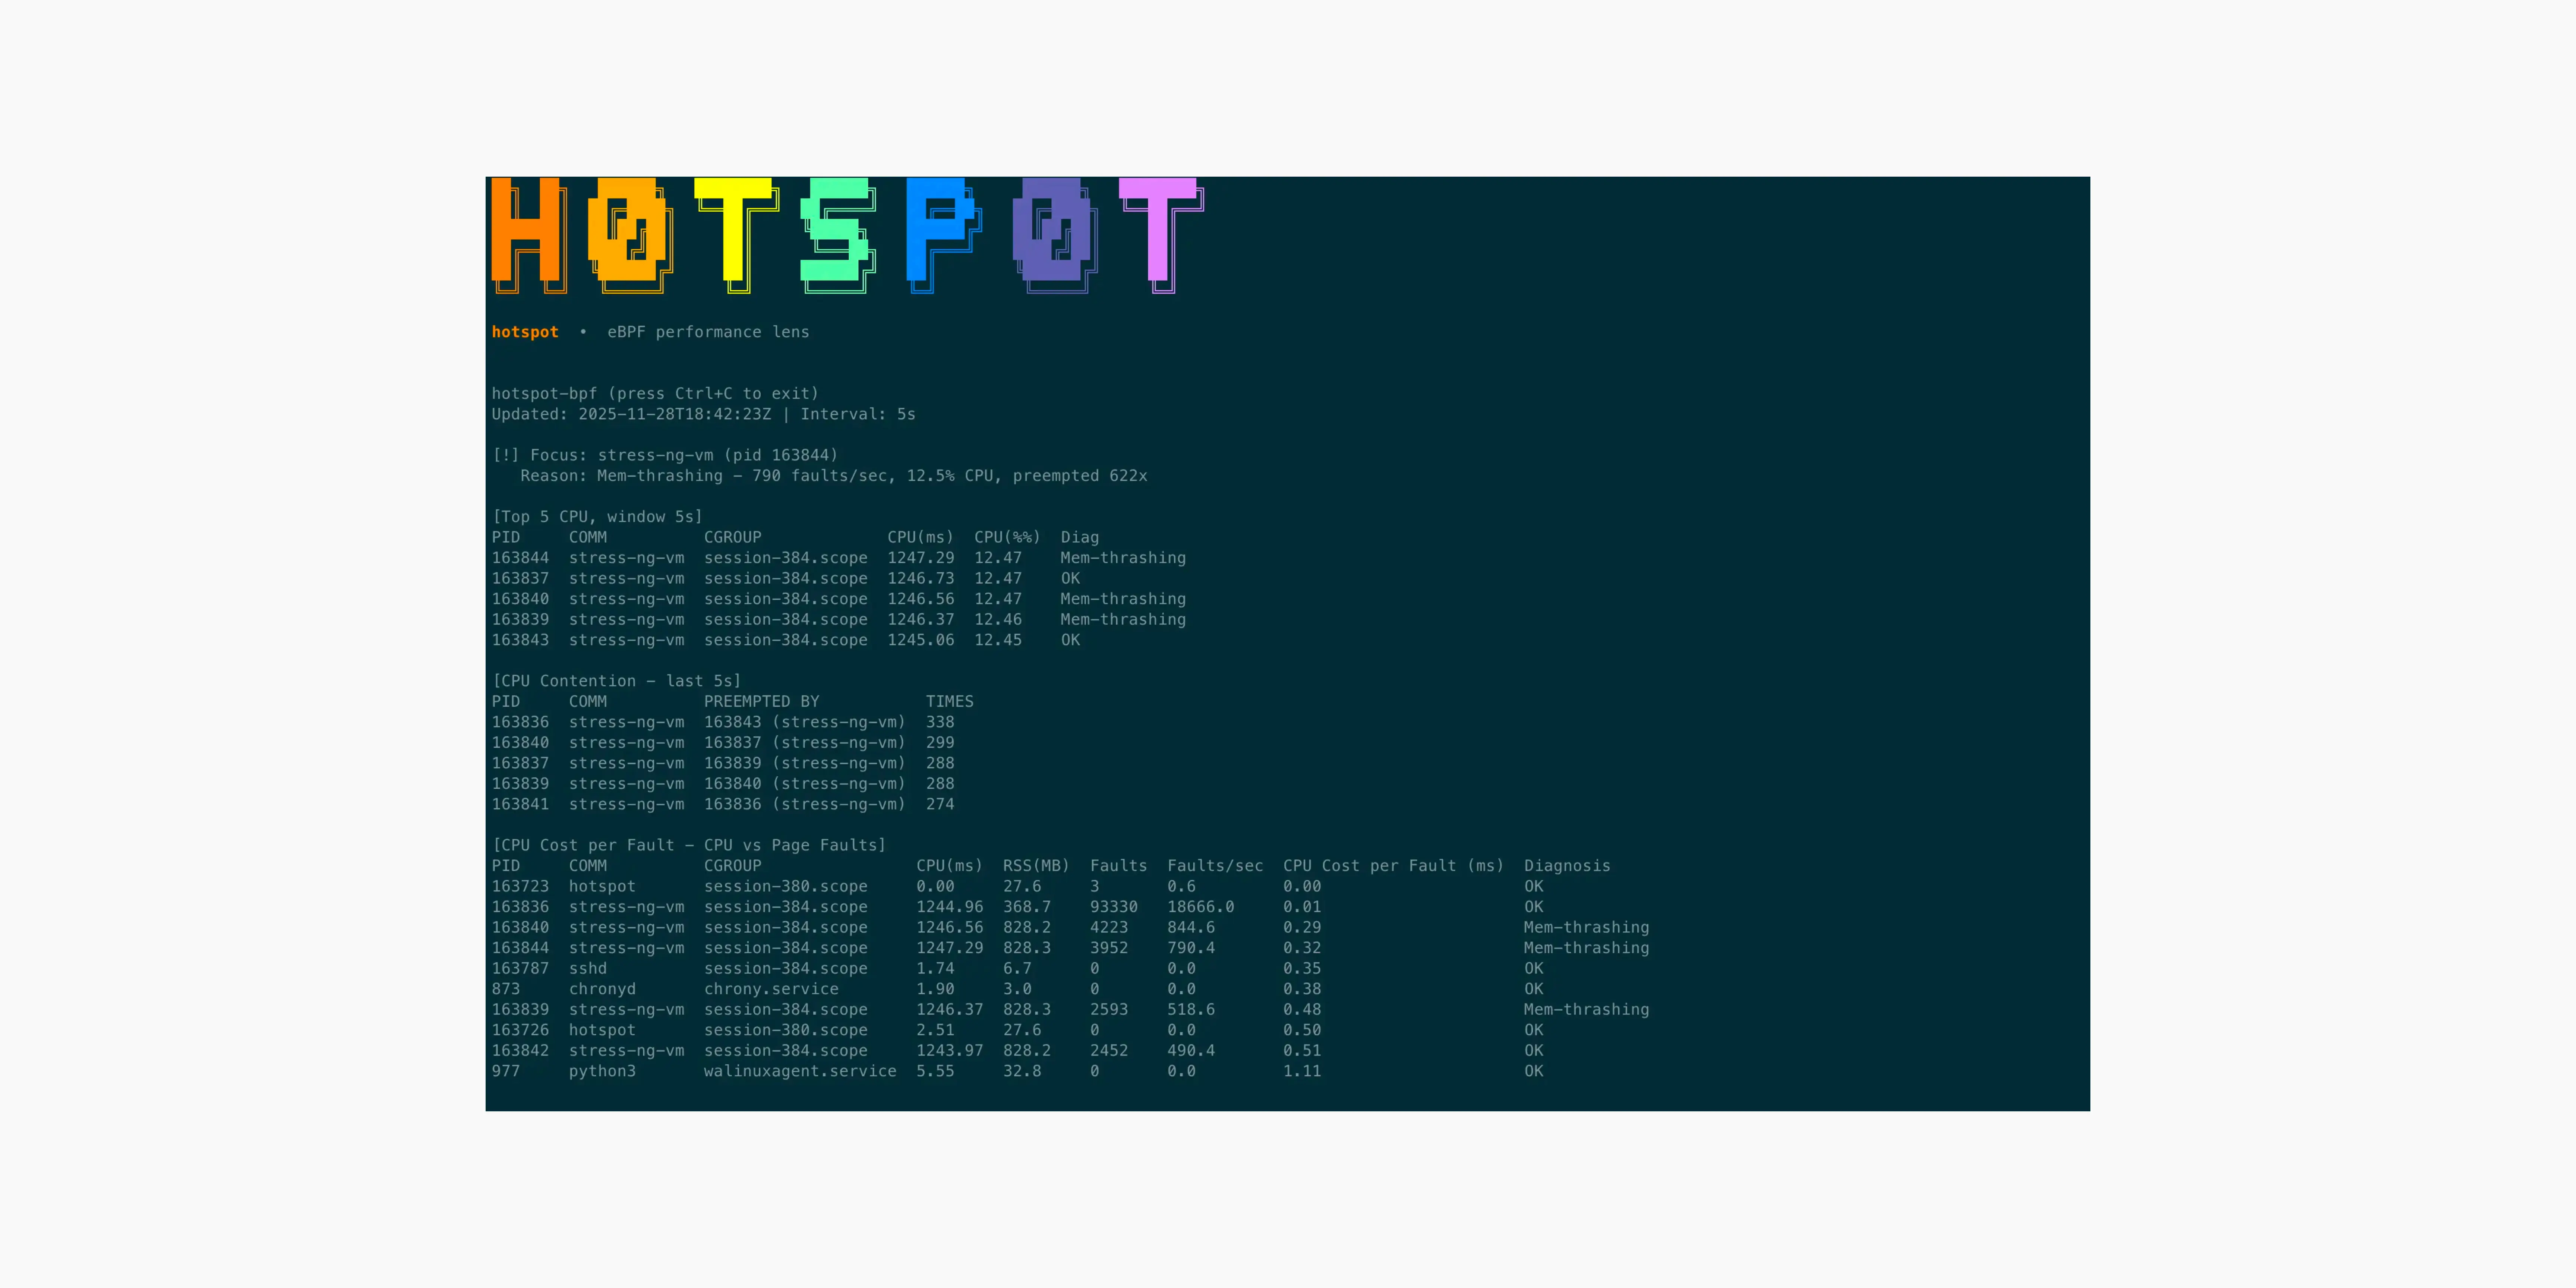
hotspot-bpf uses eBPF to turn raw kernel events into real-time performance explanations. It correlates CPU time, scheduler contention, and page-fault pressure in a single window, revealing why a process is slow, starved, or heading toward OOM.
Inspiration
This project began with a simple frustration: when a host starts slowing down or memory pressure builds up, it’s hard to understand why. Tools like top, htop, or /proc only show resource usage, not the cause of the pressure. Even when OOM events occur, it’s unclear which process actually triggered the chain of events.
I wanted a way to correlate CPU usage, scheduler contention, and page-fault pressure in the same sliding window, so we could explain performance symptoms instead of just observing them. That’s where eBPF came in, it let me capture kernel signals at the source and assemble a real-time performance storyline.
What I Learned
During this project I learned:
- eBPF tracepoints give nanosecond-accurate CPU accounting
- kprobes such as
handle_mm_faultreveal page-fault pressure in real time - CPU usage alone is meaningless, correlation is everything
- kernel BTF is critical for CO-RE and must match the host kernel
- User-space diagnosis logic matters as much as BPF collection
Implementation & Architecture
The tool consists of two main components: a set of eBPF programs running in the kernel (Kernel Space) and a user-space Go application that aggregates and visualizes the data (User Space). It is built using cilium/ebpf, bpf2go, and CO-RE (BTF-enabled), ensuring the binary can run directly on the host without recompilation.
Kernel Space: Collecting Signals
The kernel-side programs are responsible for collecting raw metrics with minimal overhead.
1. CPU & Contention Tracking (sched_switch)
To measure CPU usage without the overhead of sampling, I used the sched/sched_switch tracepoint. This fires every time the scheduler switches tasks on a CPU.
- Precise CPU Accounting: By maintaining a per-CPU state map (
BPF_MAP_TYPE_PERCPU_ARRAY), the program tracks exactly when a process starts and stops running. The delta is added to a hash map (pid_stats), giving us nanosecond-accurate CPU time for every PID. - Contention/Preemption: The tracepoint provides both the
prev_pid(the task being switched out) andnext_pid(the task being switched in). If the previous task was still runnable but got preempted, we record a “victim/aggressor” pair in a separate hash map. This allowshotspot-bpfto show exactly who is stealing CPU cycles from whom.
Here is a simplified snippet of how the scheduler hook tracks victims and aggressors:
1
2
3
4
5
6
7
8
9
10
11
12
13
14
15
16
17
18
SEC("tracepoint/sched/sched_switch")
int handle_sched_switch(struct trace_event_raw_sched_switch *ctx) {
    u32 victim = ctx->prev_pid;
    u32 aggressor = ctx->next_pid;

    if (victim != 0 && aggressor != 0) {
        // Construct a unique key for the victim/aggressor pair
        u64 pair = ((u64)victim << 32) | aggressor;
        u64 *cnt = bpf_map_lookup_elem(&cpu_contention, &pair);
        if (cnt) {
            (*cnt)++;
        } else {
            u64 init = 1;
            bpf_map_update_elem(&cpu_contention, &pair, &init, BPF_ANY);
        }
    }
    return 0;
}
2. Memory Pressure Detection (handle_mm_fault)
CPU usage is only half the story. To detect memory thrashing and OOM risks, I attached a kprobe to handle_mm_fault.
- This function is the kernel’s entry point for handling page faults.
- Every time it triggers, we increment a counter for the current PID in the
page_faultsmap. - A high rate of page faults combined with high CPU usage typically indicates “thrashing”—the process is burning CPU just trying to allocate or access memory pages.
The kprobe implementation is lightweight, simply counting faults per PID to track memory pressure:
1
2
3
4
5
6
7
8
9
10
11
12
13
14
15
SEC("kprobe/handle_mm_fault")
int BPF_KPROBE(handle_mm_fault_kprobe) {
    u32 pid = bpf_get_current_pid_tgid() >> 32;
    if (pid == 0) return 0;

    struct fault_stat *entry = bpf_map_lookup_elem(&page_faults, &pid);
    if (entry) {
        entry->faults++;
    } else {
        struct fault_stat init = {};
        init.faults = 1;
        bpf_map_update_elem(&page_faults, &pid, &init, BPF_ANY);
    }
    return 0;
}
User Space: The Go Inference Engine
The user-space application acts as the coordinator. It:
- Periodically polls the BPF maps (every few seconds).
- Correlates the signals: Is high CPU accompanied by high fault rates? (OOM Risk). Is a process using little CPU but being preempted constantly? (Starvation).
- Cleans up the maps to prevent memory leaks in the BPF maps themselves.
This “sliding window” approach allows the TUI to present a real-time story rather than just a snapshot of counters.
Challenges
The main challenge was running on Kubernetes. I attempted to integrate with bpfman for program lifecycle management, but user-space changes are still required, so I postponed Kubernetes support and focused on a single-host prototype first.
Other challenges included:
- Struct relocation issues when switching kernel versions
- Formatting CO-RE maps correctly for
bpf2go - Trimming noisy signals while keeping diagnoses accurate
- Choosing thresholds for OOM risk detection
- Making the UI readable during page-fault spikes
What hotspot-bpf Solves
Traditional tools show usage, hotspot-bpf reveals cause and effect:
- Why a process is slow (CPU-bound vs starved)
- Who is stealing CPU (victim/aggressor pairs)
- When memory is becoming unstable
- How close the system is to an OOM kill, before it happens
What’s Next
- Kubernetes support using
bpfman - JSON export mode for Grafana / Prometheus
- Automatic alerting when “OOM risk” is detected
- Optional Stack sampling using
bpf_get_stackid - Cgroup filtering per namespace / tenant
Featured on eCHO Live
hotspot-bpf was mentioned in episode 199 of eCHO Live (eBPF & Cilium High Overview).
Skip to 52:13 for the mention.
Final Reflection
This project began with a debugging frustration, and turned into a kernel-level forensic tool. Working with eBPF taught me how much the kernel already knows, and how little of it we usually see.